Tables
Table blocks are used to display continuous data in a defined time range.
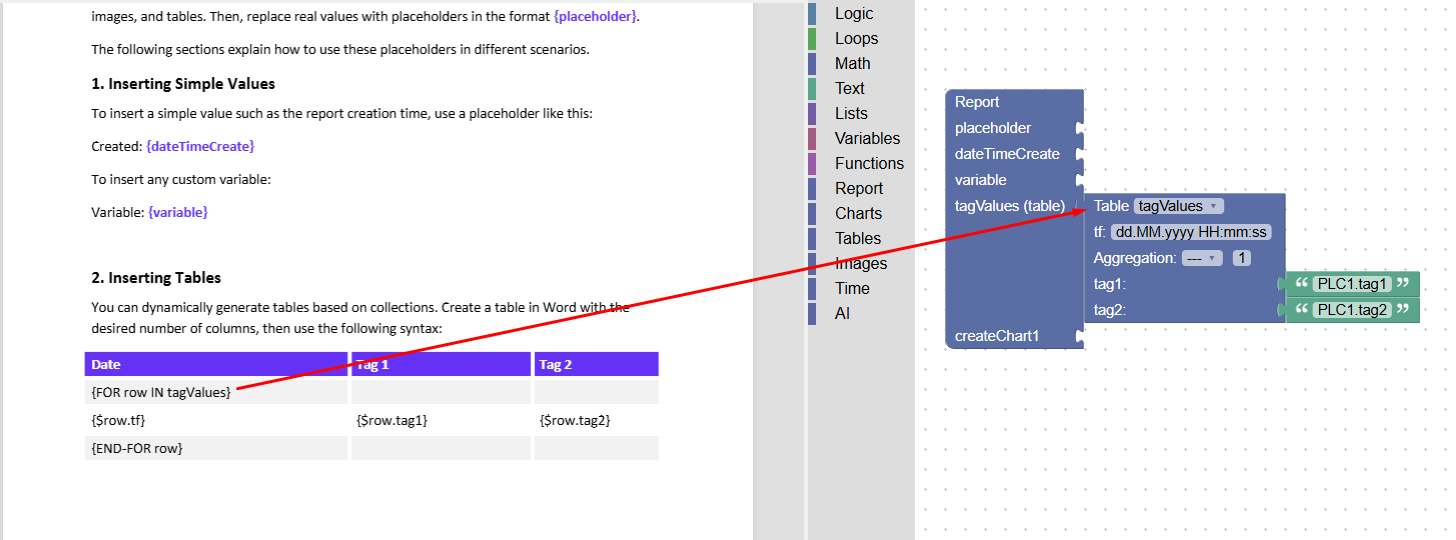
The default table “tagValues”, which can be found in the default template, inherits its name from the placeholder “{FOR row IN tagValues}”. It takes historical data of a specified input (tag) in the specified time range.
Block allows for specifying the time format “tf” and selecting the type of data aggregation.
This type of table takes as an input data “Tag Name (string)“
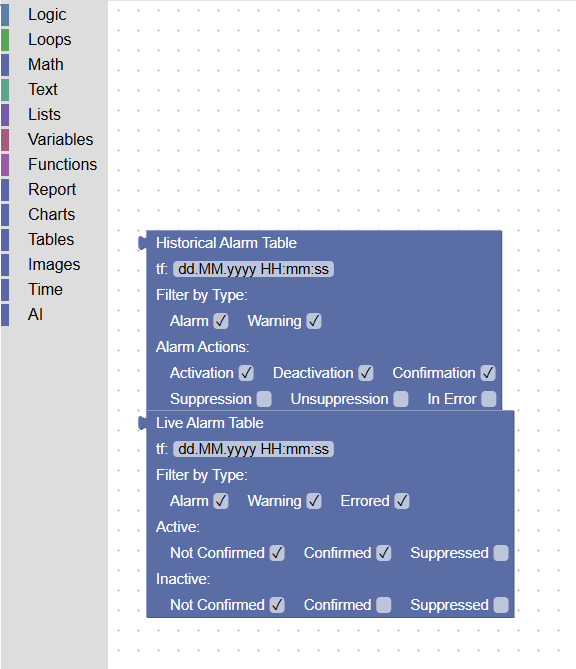
Historical & Live Alarm Table
These two types of tables take as input historical & live alarm data within a specified time range
Charts / Images
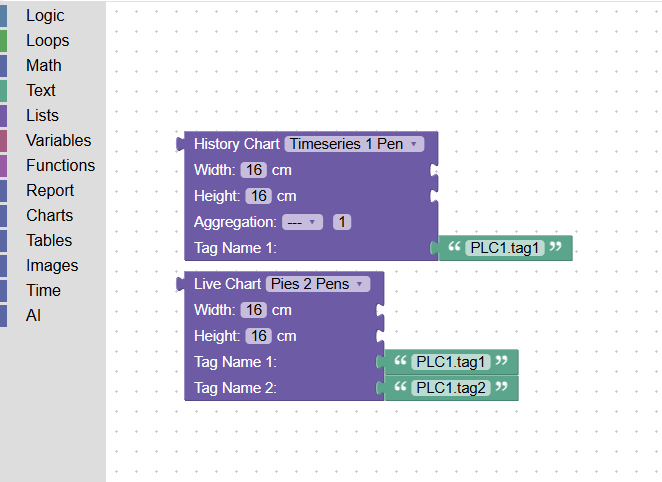
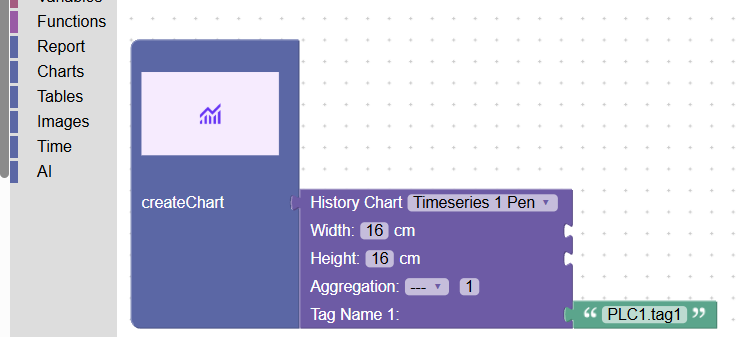
Charts are supposed to replace the placeholders {IMAGE chartX()}
- Historical: Displays historical data within a specified time range.
- Input: Tag Name
- Live Chart: Displays “live” values that are present in the datapoint at the time when the chart is generated
- Input: Tag Name
Charts allow specifying its width & height, you can also use aggregation for the data.
This category can also include the “Images” category, as an image can serve as a placeholder. The key difference is that the placeholder image size is used to scale to the input size for the image used in the chart block.
AI
You’re able to use this block as an input for {variable} or {placeholder} as the output of AI block is a string – the system will send a question to AI and then the output of the question will be inserted into the report
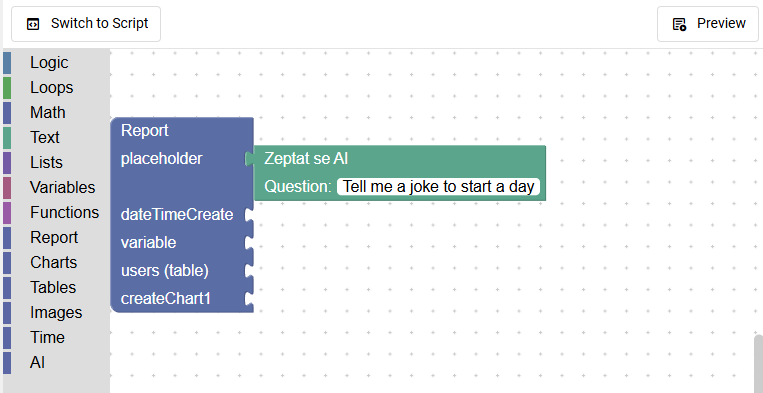
For this function to be working you need to purchase any product that includes AI module like AI alarm & notify to set-up the AI