
Real-time Dashboards
create, customize and visualize data insights
all in one
Key Advantages
Our pricing is determined by the project size (number of tags), while everything else is unlimited. All product features are included. No hidden costs, just a clear, fair deal.
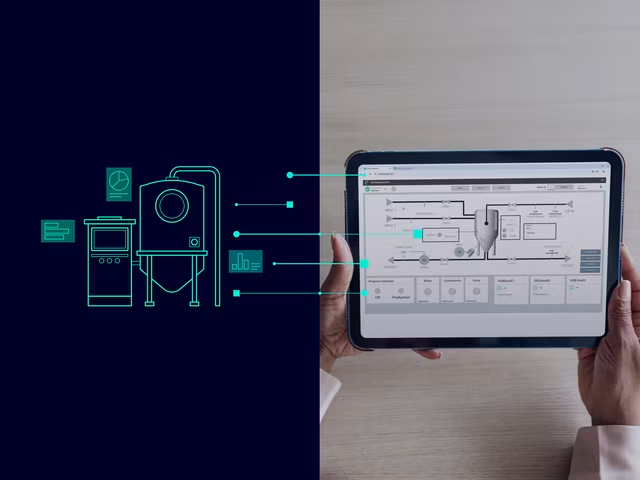
Direct Connectivity
From machines to Dashboards in minutes.
Data Store
Data acquisition + Integrated Historian + Visualization
Drag & Drop
Simple and quick project creation, no coding
all in one
Key Advantages
Our pricing is determined by the project size (number of tags), while everything else is unlimited. All product features are included. No hidden costs, just a clear, fair deal.
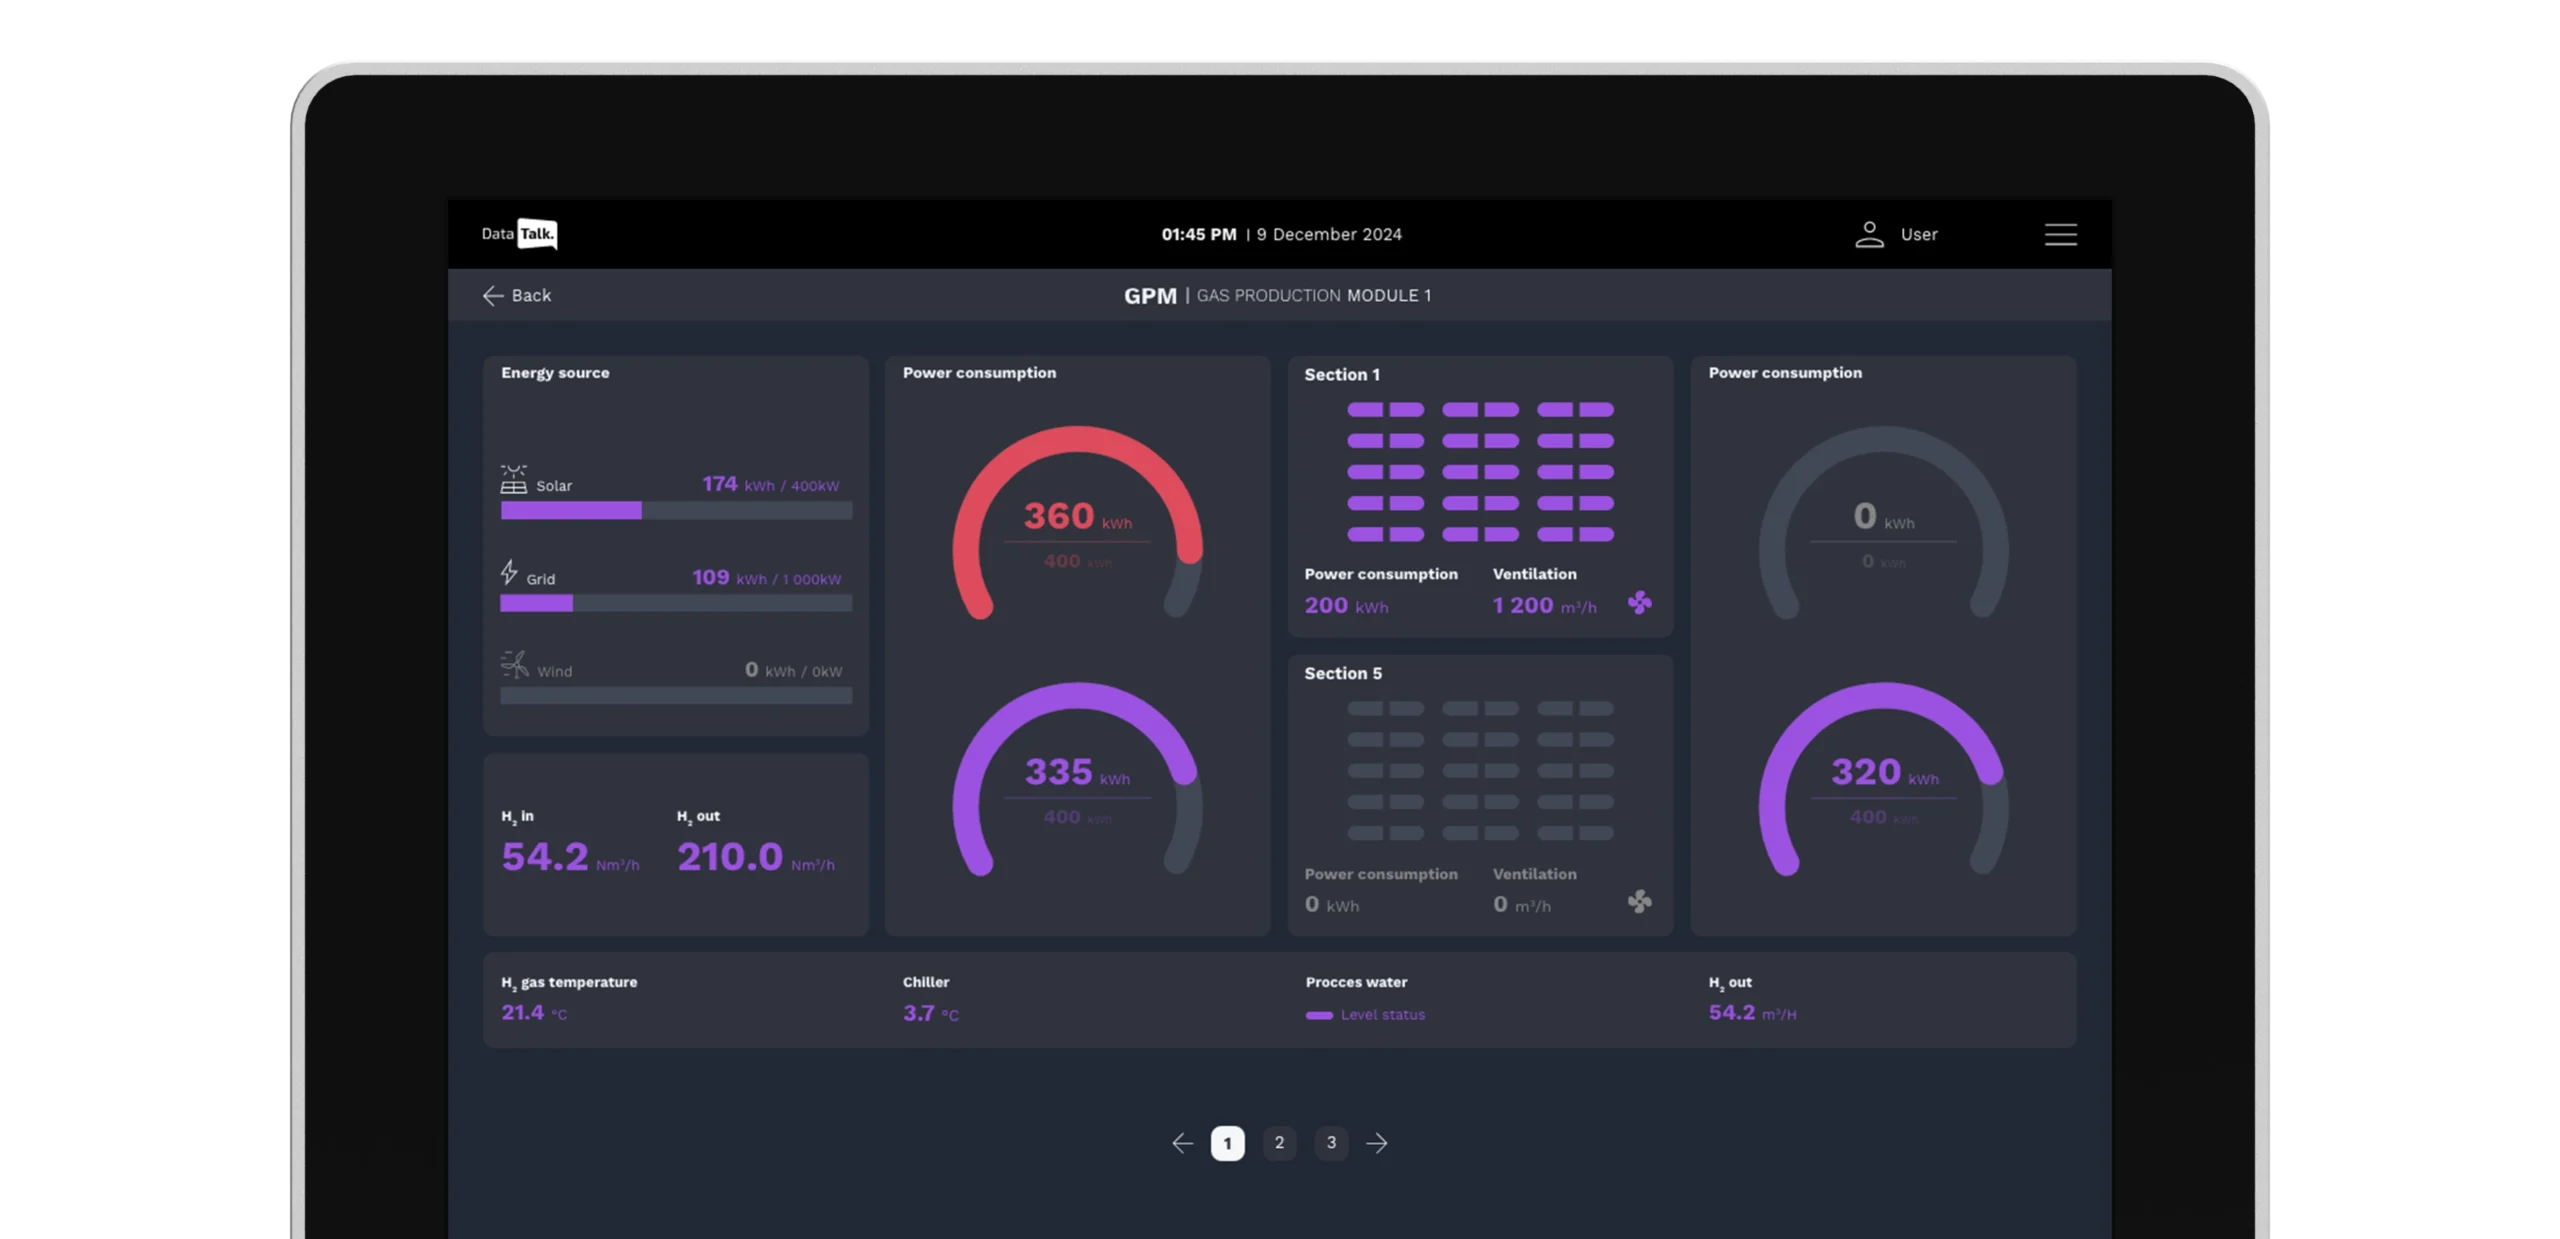
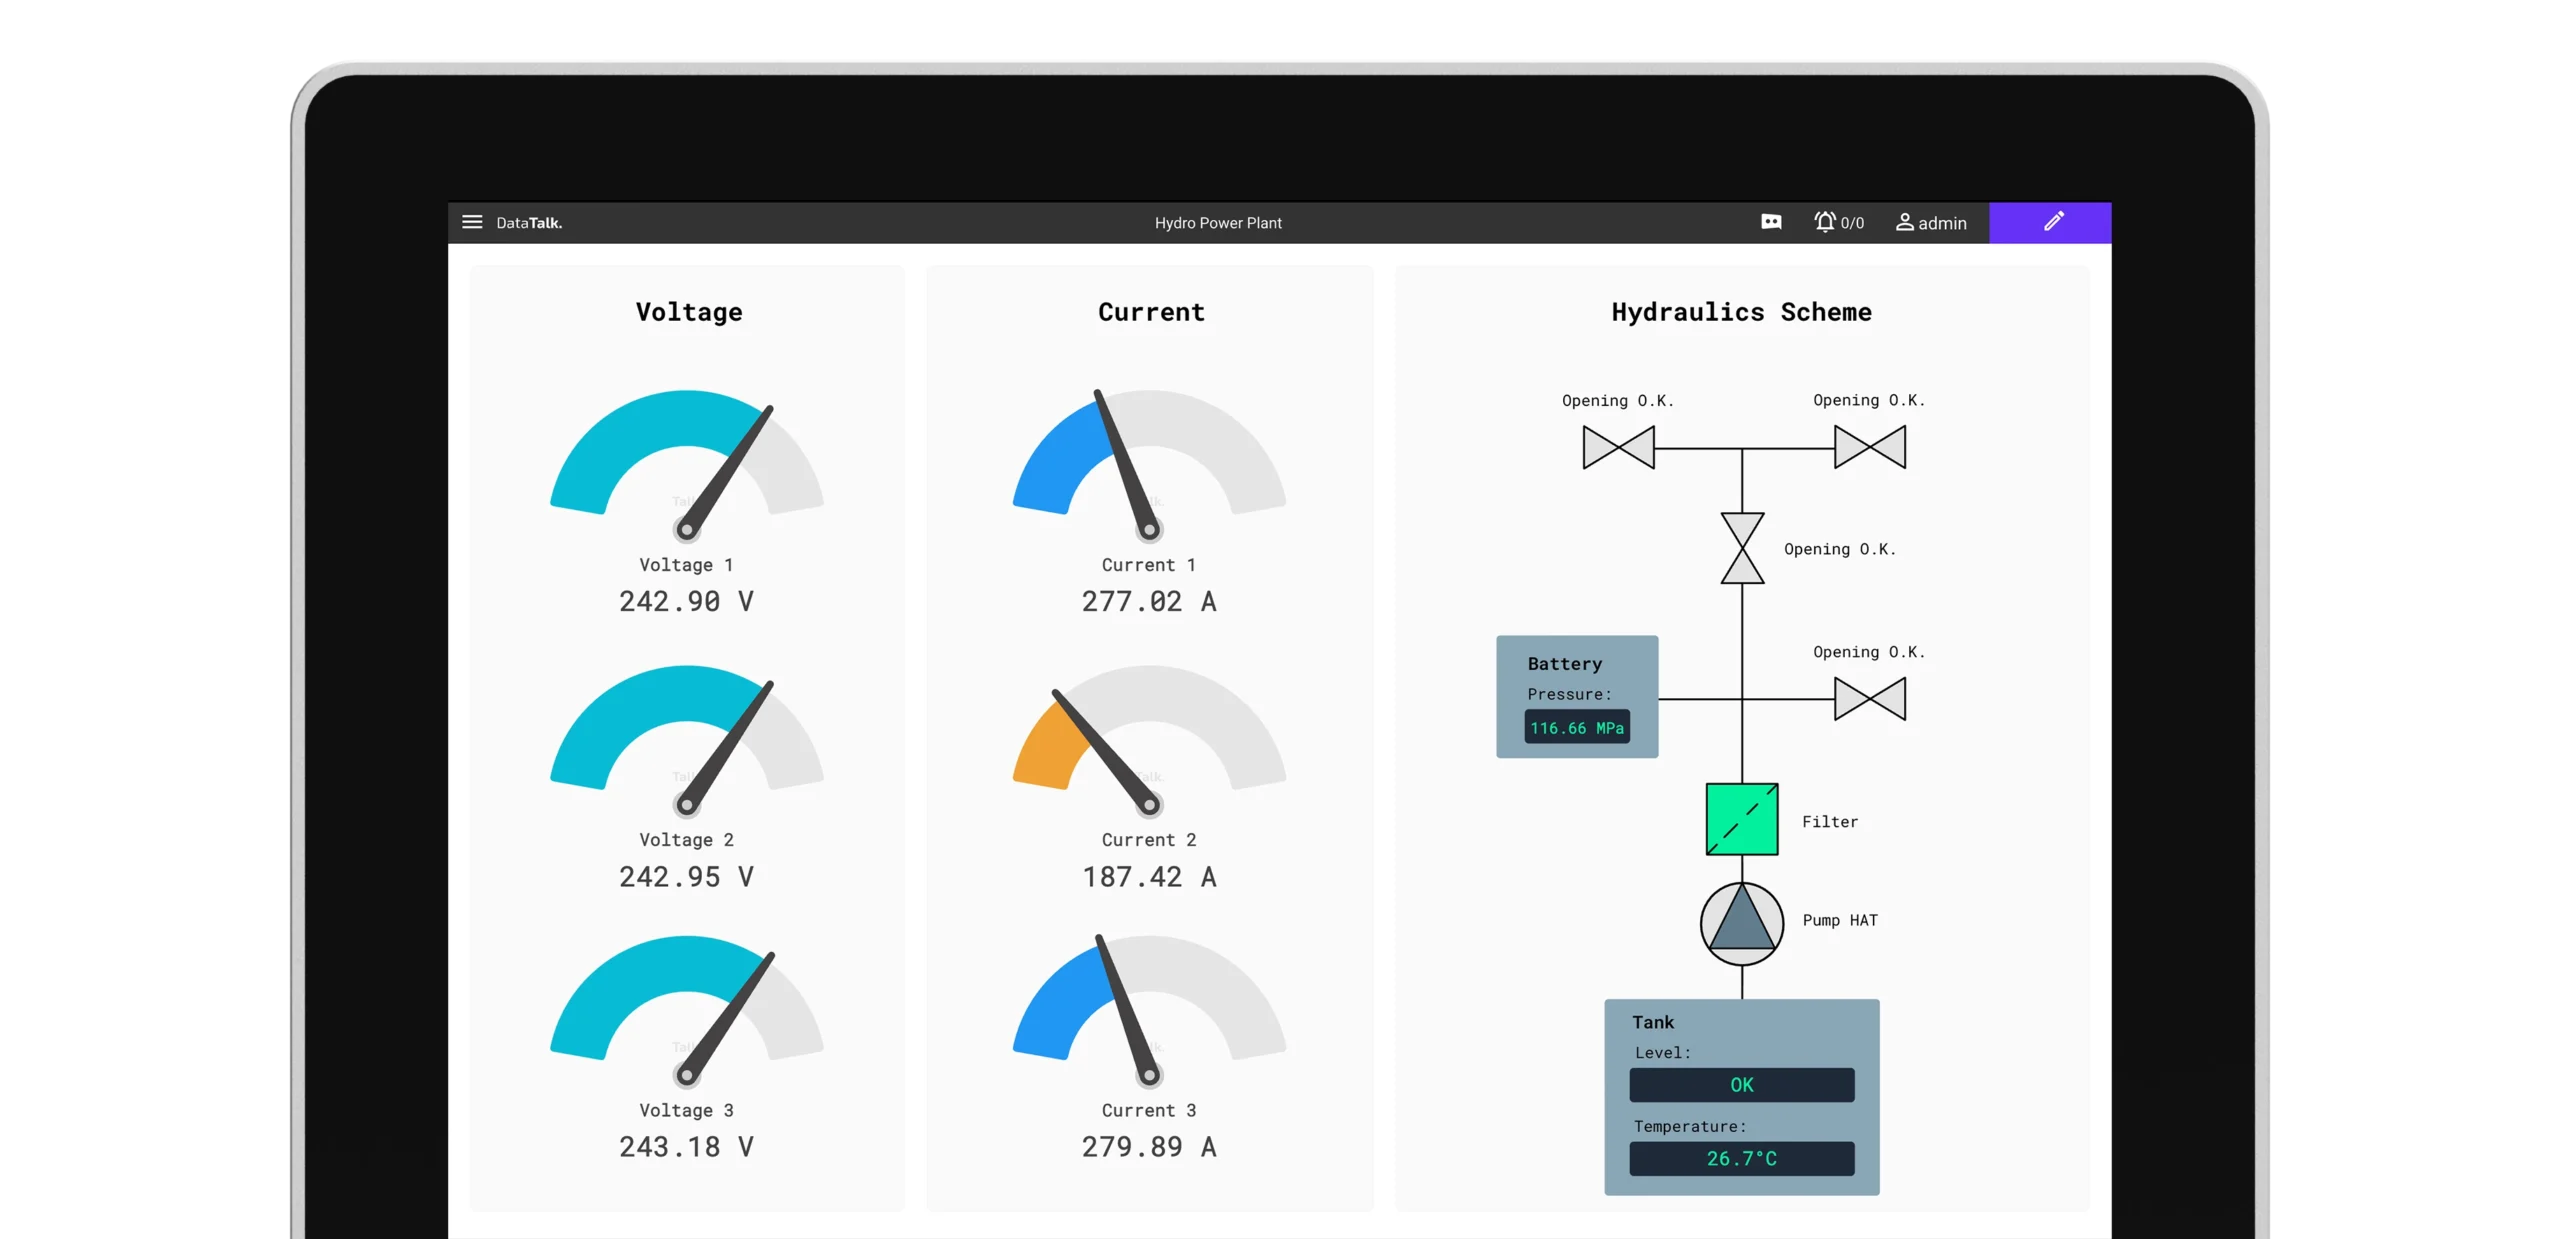
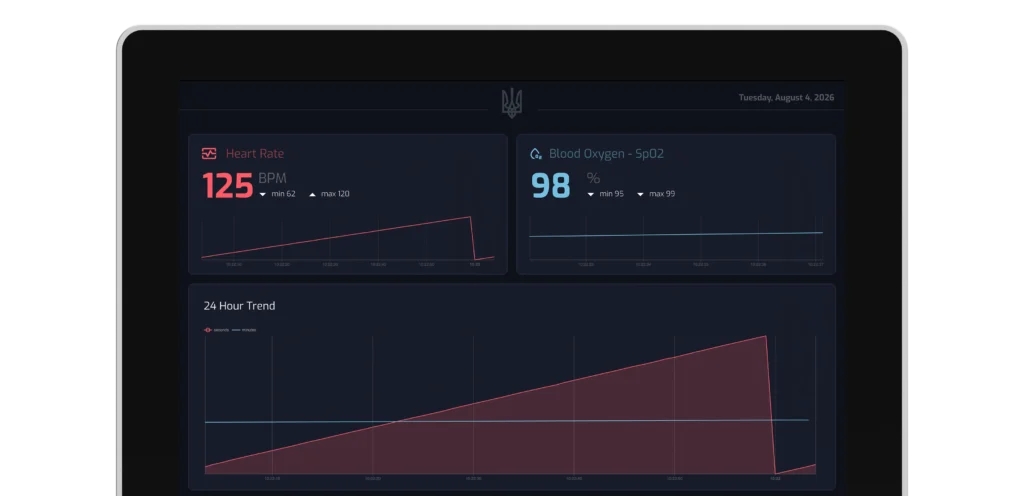
Ready to Use Graphics
PI&D Sysmbols
Main Features

Process data from PLCs, IIoT sensors, MQTT, databases, etc.

Log data into a time-series database (Historian)

Combine live and historical data using graphical components

Use charts, gauges, PI&D symbols and 200+ components

Build dashboards with drag & drop

For mobile devices (smart phone, tablet)

On-premise solution – protect critical data

No-code graphical compute module
Compared to the competition
DataTalk Advantages
| Capability | DataTalk RT Dashboards | Grafana | Power BI | Ignition Perspective |
|---|
| Real-time dashboards | ⭐⭐⭐⭐⭐ | ⭐⭐⭐⭐⭐ | ⭐⭐⭐ | ⭐⭐⭐⭐⭐ |
| PLC / industrial connectivity | ⭐⭐⭐⭐⭐ | ⭐⭐ | ⭐⭐ | ⭐⭐⭐⭐⭐ |
| MQTT / IIoT | ⭐⭐⭐⭐⭐ | ⭐⭐⭐⭐ | ⭐⭐⭐ | ⭐⭐⭐⭐ |
| Built-in Historian | Yes | No | No | Yes |
| Data acquisition | Yes | No | No | Yes |
| No-code configuration | ⭐⭐⭐⭐⭐ | ⭐⭐⭐ | ⭐⭐⭐⭐ | ⭐⭐⭐⭐ |
| Industrial HMI | ⭐⭐⭐⭐ | ⭐⭐ | ⭐ | ⭐⭐⭐⭐⭐ |
| 2D/3D process visualization | ⭐⭐⭐⭐⭐ | ⭐⭐ | ⭐⭐ | ⭐⭐⭐⭐⭐ |
| Charts / analytics | ⭐⭐⭐⭐ | ⭐⭐⭐⭐⭐ | ⭐⭐⭐⭐⭐ | ⭐⭐⭐⭐ |
| Number of visual components | 200+ | Very large | Large | Large |
| SQL / business data | ⭐⭐⭐⭐ | ⭐⭐⭐⭐⭐ | ⭐⭐⭐⭐⭐ | ⭐⭐⭐⭐ |
| Logs / observability | ⭐⭐ | ⭐⭐⭐⭐⭐ | ⭐⭐⭐ | ⭐⭐ |
| Business BI | ⭐⭐⭐ | ⭐⭐⭐ | ⭐⭐⭐⭐⭐ | ⭐⭐⭐ |
| Alarm/notification integration | ⭐⭐⭐⭐⭐ | ⭐⭐⭐⭐⭐ | ⭐⭐⭐⭐ | ⭐⭐⭐⭐⭐ |
| Mobile responsive | ⭐⭐⭐⭐⭐ | ⭐⭐⭐⭐ | ⭐⭐⭐⭐⭐ | ⭐⭐⭐⭐⭐ |
| On-premise | ⭐⭐⭐⭐⭐ | ⭐⭐⭐⭐⭐ | ⭐⭐⭐ | ⭐⭐⭐⭐⭐ |
| Edge deployment | ⭐⭐⭐⭐⭐ | ⭐⭐⭐ | ⭐ | ⭐⭐⭐⭐⭐ |
| AI / LLM integration | ⭐⭐⭐⭐⭐ | ⭐⭐⭐⭐ | ⭐⭐⭐⭐⭐ | ⭐⭐⭐ |
| Installation complexity | Very low | Medium | Low/medium | Medium |
| No separate Database | Yes | Usually no | Usually no | Usually no |
| Lifetime license option | Yes | OSS / subscription | Subscription | License |
| Best for | Industrial monitoring | IT/OT observability | Business analytics | SCADA/HMI |
Pricing
Licences
Our pricing is determined by the project size (number of tags), while everything else is unlimited. All product features are included. No hidden costs, just a clear, fair deal.
Our lifetime licensing ensures you maintain full ownership and control over your software.
Personal
For non-commercial projects only.
€0
Lifetime license *
- Unlimited number of clients
- 50 Tags
- Community support
S
For small and mid-sized projects.
€600
Lifetime license *
- Unlimited number of clients
- 150 Tags
- Limited support
M
For mid to large projects with no compromise.
€2 000
Lifetime license *
- Unlimited number of clients
- 1 500 Tags
- Full support
L
Unlock the unlimited world of experiences.
€
On request
Lifetime license *
- Unlimited number of clients
- UNLIMITED Tags
- Premium support
Modules included in DataTalk Real-time Dashboards product:
Data In
Compute
Data logging
Project Designer
Dashboards
Components library
Charts
Views
3D views
* Updates are free for 1 year. After 1 year, the price of updates is 20% of the license price annually.
Community support – e.g., forums, basic FAQs / Limited support – email, three working days response / Full support – email, one working day response, SLA option / Premium support – priority email and phone support, live chat support – direct access to one of our technicians, SLA option.
FAQ
Common questions,
quick answers
Whether it’s a question, suggestion, or compliment, we’re here to listen. Reach out via contact form. We’ll get back to you promptly.
View all FAQs →


Technical Datasheet
- Connectivity
- Operating System
- Licences
- Minimal System Requirements
- Assets
- Typical Industries
- Notification Channels
| OPC UA | Siemens S7-1500 (Native OPC UA server), Beckoff TwinCat, B&R X20 & X90, Schneider Electric M580, Omron NX/NJ, Allen-Bradley, CompactLogix, ControLogix |
| Modbus TCP/UDP | S7-1200 / 1500, Schneider modicon, Wago PFC200, Beckoff, Omron CP, Allen-Bradley, Micrologix, Unitronics Vision |
| Ethernet/IP | Allen-Bradley, Omron NX/NJ, Schneider M580, Beckofff TwinCAT, WAGO |
| Ethernet IP (Micro 800) | Allen-Bradley (Micro 800) |
| MQTT | Wago PFC200, B&R X20 & X90, Schneider EcoStruxure PLC, Balluff IO-Link gateways, IFM |
| REST API | Beckhoff, WAGO PFC200, B&R Automation, Schneider EcoStruxure, any IT system supporting RestAPI interface |
| Databases | Microsoft SQL, mySQL, Oracle DB, Postgress, MongoDB, MariaDB |
| Loxone | Miniserver, Miniserver Compact, Miniserver Go |
| Windows | Windows 11 – 23H2 and newer |
| Linux | Ubuntu – 22.04 and newer, Debian 12 and newer, Raspian 12 and newer |
| Docker | Any environment that supports Docker images (for example, Docker Desktop on macOS) |
| Personal* | Lifetime licence, Unlimited number of clients, 50 tags, Community support |
| S | Lifetime licence, Unlimited number of clients, 150 tags, Limited support |
| M | Lifetime licence, Unlimited number of clients, 1 500 tags, Full support |
| L | Lifetime licence, Unlimited number of clients, UNLIMITED tags, Premium support |
*Personal license is for non-commercial projects only.
| Processor | 4 Core CPU |
| Memory (RAM) | 8 GB |
| Storage | 128 GB SSD |
| Default Graphical Components | Analog Gauges, Digital Gauges, Bars Vertical, Bars Horizontal, Buttons, Data & Time, Displays, Special, User Interface, … |
| Customer Graphical Components | Create your own vector graphics and elements in our integrated visual editor. |
| P&ID Symbols | Centrifuges, Compressors, Crushes, Dryers, Filters, Instrument, Mixers, Motors, Peripheral, Pumps, Valves, Vessels, |
| Icon & Material Symbol (Google) | Outlined, Rounded, Sharp |
| Bitmap images | Upload your own images in .jpeg or .png format. |
| Industrial Automation & Process Monitoring | Real-time control and monitoring of industrial processes and equipment. |
| Smart Manufacturing & Industry 4.0 | Data-driven manufacturing with connected machines and intelligent systems. |
| Energy Management & Optimization | Monitoring and optimizing energy consumption and efficiency. |
| Smart Buildings & Infrastructure | Automated control and monitoring of building systems and infrastructure. |
| Logistics & Warehouse Management | Tracking and optimizing goods movement and warehouse operations. |
| Oil, Gas & Petrochemical Monitoring | Monitoring assets, processes, and safety in oil and gas operations. |
| Utilities & Smart Grids | Managing and optimizing electricity, water, and gas distribution networks. |
| Remote Asset & Equipment Monitoring | Monitoring asset health and performance from remote locations. |
| Healthcare & Medical Devices | Monitoring medical equipment and healthcare system data. |
| Fleet & Mobility Management | Tracking and optimizing vehicle fleets and mobility services. |
| Automotive & Connected Vehicles | Collecting and analyzing data from connected vehicles and systems. |
| Agriculture & Smart Farming | Data-driven monitoring and automation of agricultural operations. |
| Retail & Smart Point-of-Sale | Monitoring retail operations and intelligent point-of-sale systems. |
| Telecommunications & Network Monitoring | Monitoring network performance, availability, and traffic. |
| Public Safety & Emergency Services | Supporting real-time monitoring and coordination for emergency response. |
| Transportation & Smart Railways | Monitoring and optimizing transportation systems and railway operations. |
| Aerospace & Aviation Monitoring | Monitoring aircraft systems and aviation operations. |
| Mining & Heavy Industry | Monitoring equipment, safety, and processes in heavy industries. |
| Water & Wastewater Management | Monitoring and controlling water treatment and distribution systems. |
| Environmental Monitoring & Sustainability | Tracking environmental data to support sustainability goals. |
| Marine & Port Operations | Monitoring port infrastructure, vessels, and logistics operations. |
| Africas Talking, Apprise API, Automated Packet Reporting System (APRS), AWS SES, AWS SNS, Bark, BlueSky, BulkSMS, BulkVS, Burst SMS, Chanify, Clickatell, ClickSend, DAPNET, DingTalk, Discord, D7 Networks, E-Mail, Emby, Enigma2 Devices, FCM (Google Firebase Cloud Messaging), Feishu, Flock, Free-Mobile, Google Chat, Gotify, Growl, Guilded, Home Assistant, httpSMS, IFTTT, Jira, Join, Kavenegar, KODI, Kumulos, LaMetric Time/Clock, Line, Mastodon, Mailgun, Matrix, Mattermost, MessageBird, Microsoft Power Automate / Workflow (MSTeams), Microsoft Teams, Misskey, MQTT, MSG91, Nextcloud Messaging, Nextcloud Talk, Ntfy, Notica, Notifiarr, Notifico, Office 365, OneSignal, Opsgenie, PagerDuty, Pagertree, Parse Platform, Plivo, Popcorn Notify, Prowl, PushBullet, PushDeer, Pushed, Pushjet, PushMe, Pushover, PushSafer, Pushy, Reddit, Resend, Revolt, Rocket.Chat, RSyslog (Remote Syslog), Ryver, SendGrid, SendPulse, ServerChan, Seven, SFR, SimplePush, Sinch, SIGNL4, Signal (API), Slack, SMSEagle, SMS Manager, SMTP2Go, SparkPost, Splunk (VictorOps) On Call, Streamlabs, Synology, Syslog, Techulus Push, Telegram, Threema Gateway, Twilio, Twist, X (formerly known as Twitter), Voip.ms, Vonage, XBMC, Webex Teams, WeCom Bot, WhatsApp, WxPusher, Zulip |
Get in touch
Your feedback matters
Whether it’s a question, suggestion, or compliment, we’re here to listen. Reach out via contact form. We’ll get back to you promptly.
office
Czech Republic
Velvarská 1699/29
Prague
Czech Republic
office
Germany
Marktplatz 6
Thierstein
Germany
I have read and agree to the Privacy Policy.